What I Learned
Our culture talks a lot about social media and its effect on users but most of us spend at least 8 hours a day at our job using internal systems. During my work at this position/company I understood that enterprise design is just as important as other types of design and can have great rewards. I learned that UX design and research can tackle some very complex problems like enterprise design. Moreover, I learned that planning and research of your users is very important and should not be under estimated. Finally, I think continuing to learn and grow in your craft only adds value in the final design.
About the Company
International company that creates packaging solutions with product offerings such as; pressure sensitive labels, shrink sleeves, flexible packaging, folding cartons and label applicators.
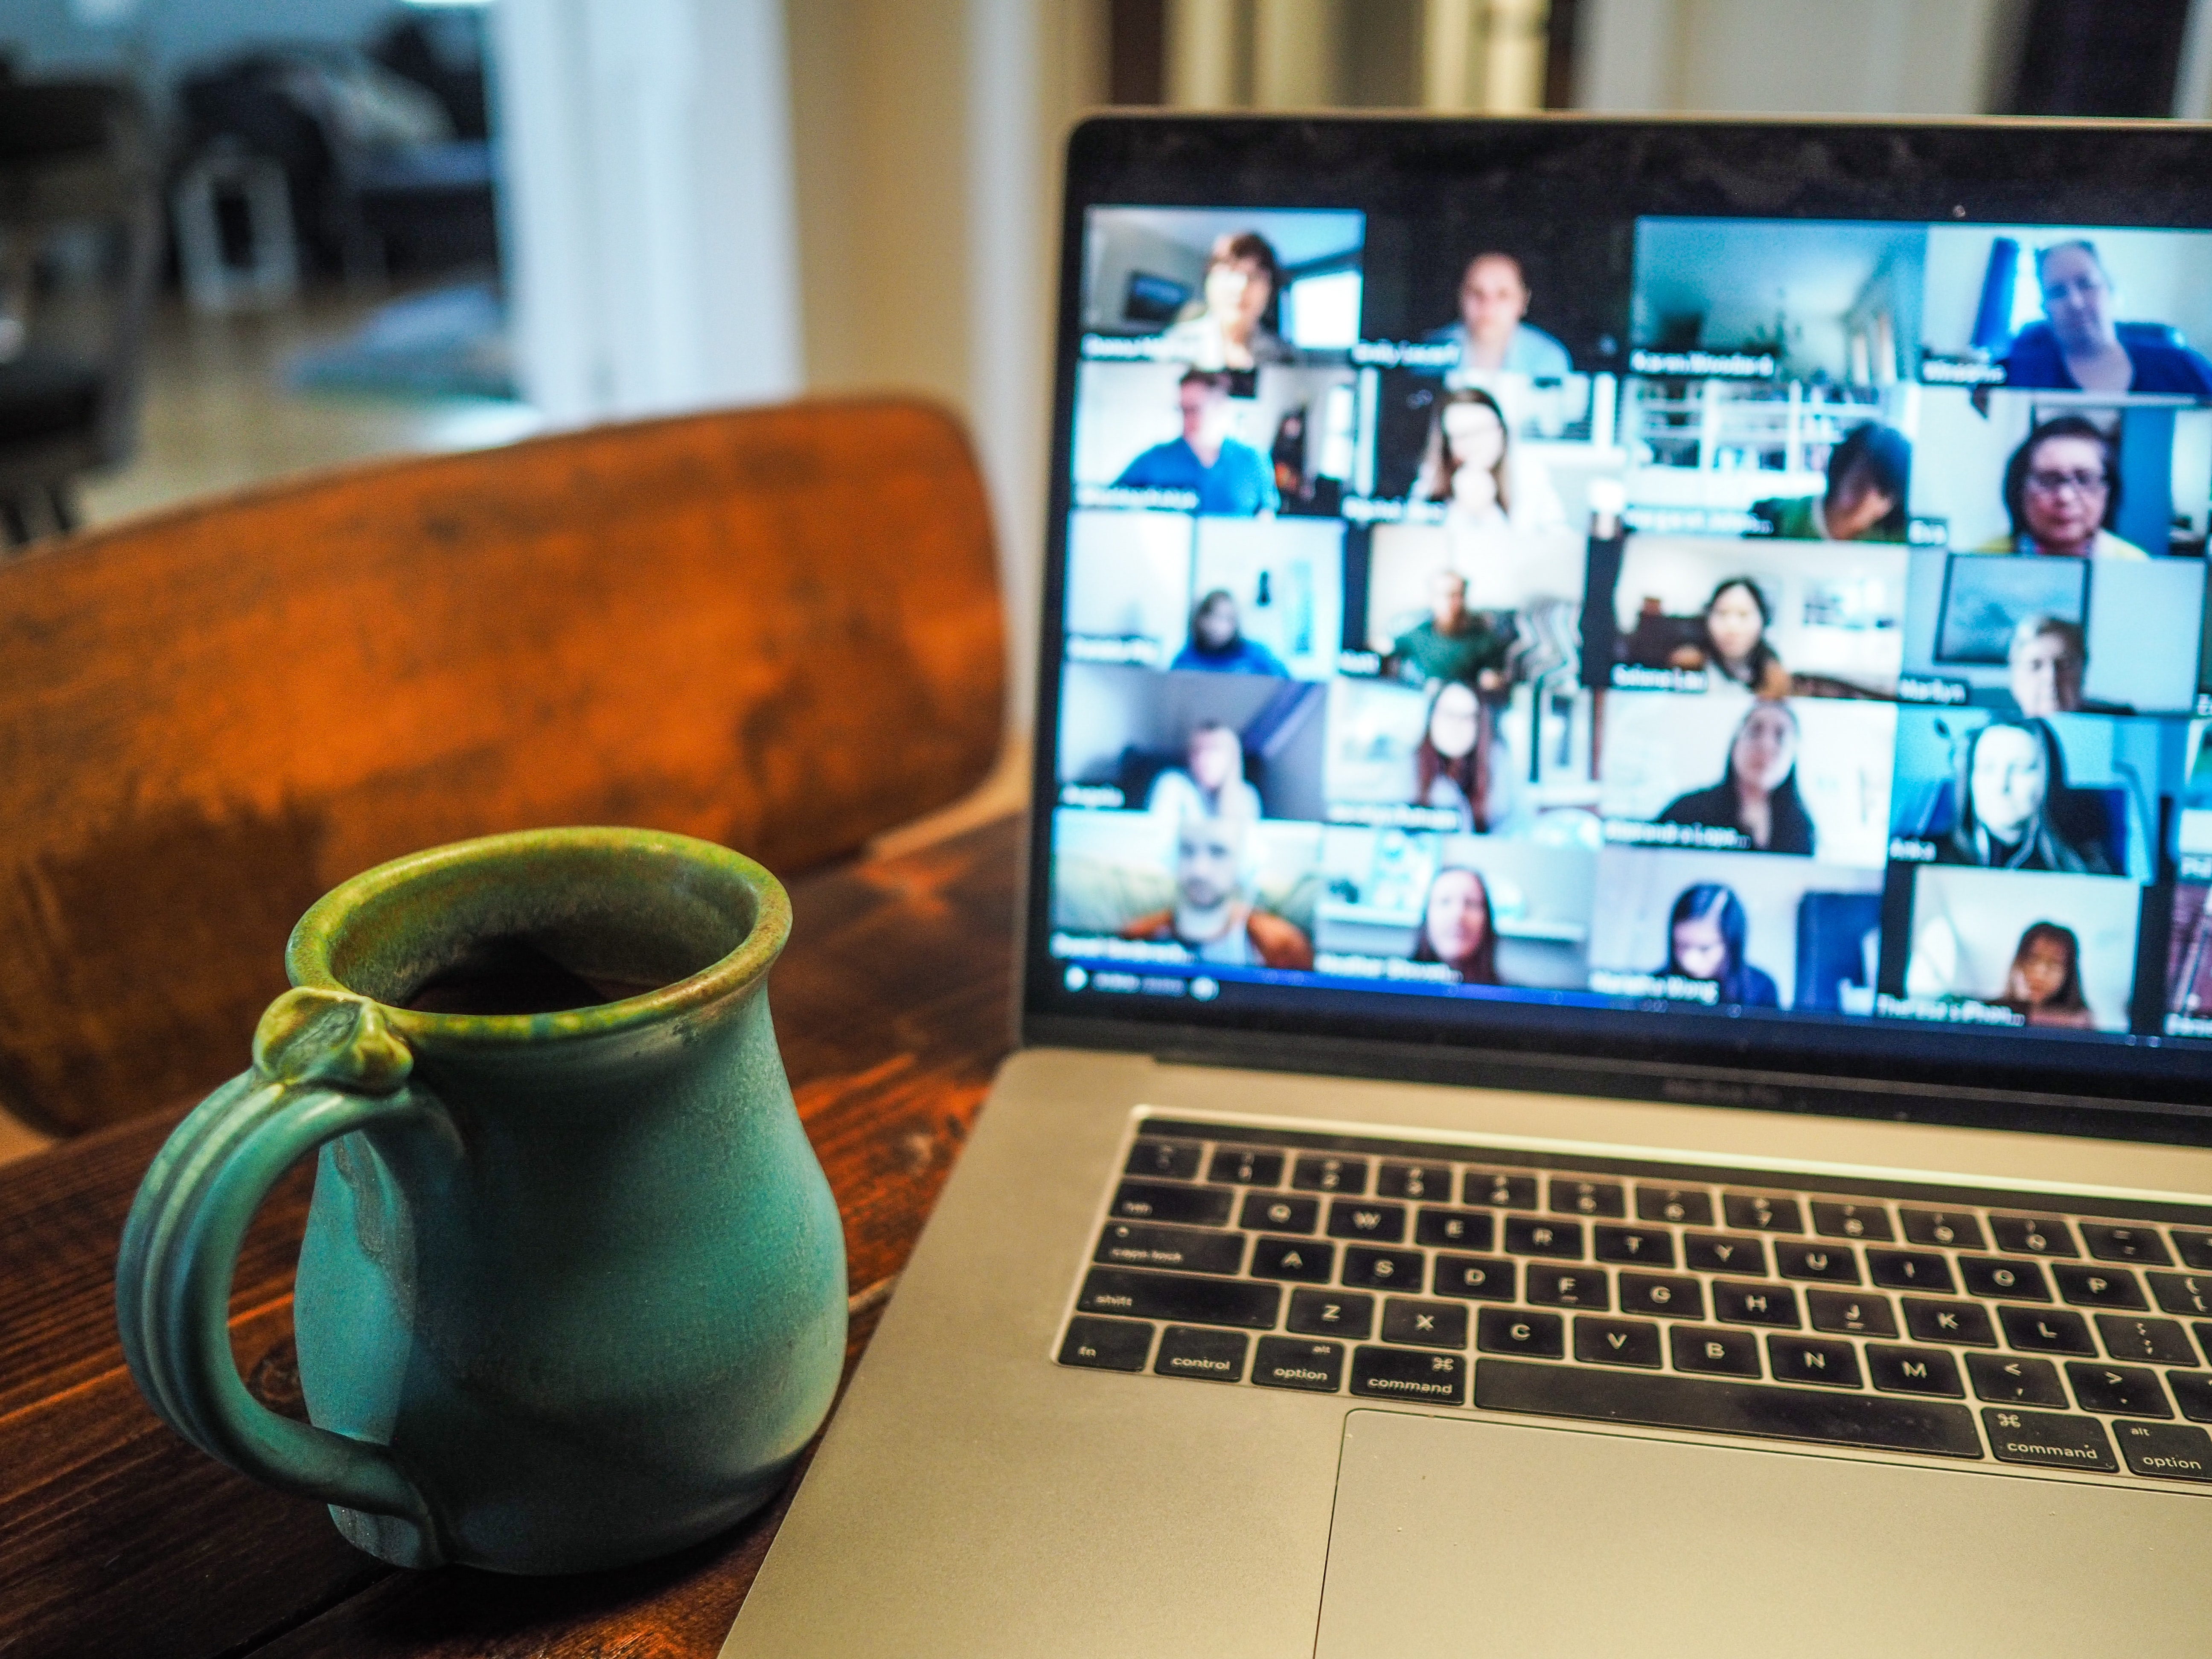
I started working on the job after only 2 months of the projects inception. I was part of an internal/external team(s) that designed an enterprise/Enterprise resource planning (ERP) system for a manufacturing company. I did both UI design and UX research. This work was done both in-person and remotely.
Problem
Design an ERP that combines 5 existing ones into 1. The system will be used by over 1,000 employees in departments like; sales, customer service, estimating, prepress, etc.
Team
Framework: Agile/Scrum
Internal: Product Owner, Scrum Master, Developers (2), UX Design (1)
External (Offshore): Product Manager, Developers, (10+), Design (1 UX & 1 Lead)
Tools
Figma (Design), Slack (Communication), Jira, (Sprint tasks & Kanban board) Confluence (Documentation), Zoom, Teams (Asynchronous/Synchronous Meetings), Microsoft Forms, Tableau (Surveys/Executive Summary)
Documentation
I kept internal materials such as; user testing scripts, videos of user testing and other ancillary materials in a document on Confluence. This was for stakeholders, designers and developers to see UX/UI for future reference.
Research
Contextual Inquiry
I conducted field studies/contextual inquiry to understand the complex workflows of areas like; prepress, press operators, customer service, sales, receiving, quality coordinator, etc. I observed and wrote notes on how each employee used their current ERP system in the context of their work, which would help inform me on designing the new system. In Figure 1A & 1B you can see that I took handwritten notes on these inquiries but did not audio/video record users because that might make them feel uncomfortable and not share as much information with me. After these inquiries I retyped my notes digitally and included them in our documentation. I made sure these notes were retyped soon after the inquiries, so I wouldn't lose detail or context.

Fig. 1A: Contextual Inquiry Notes
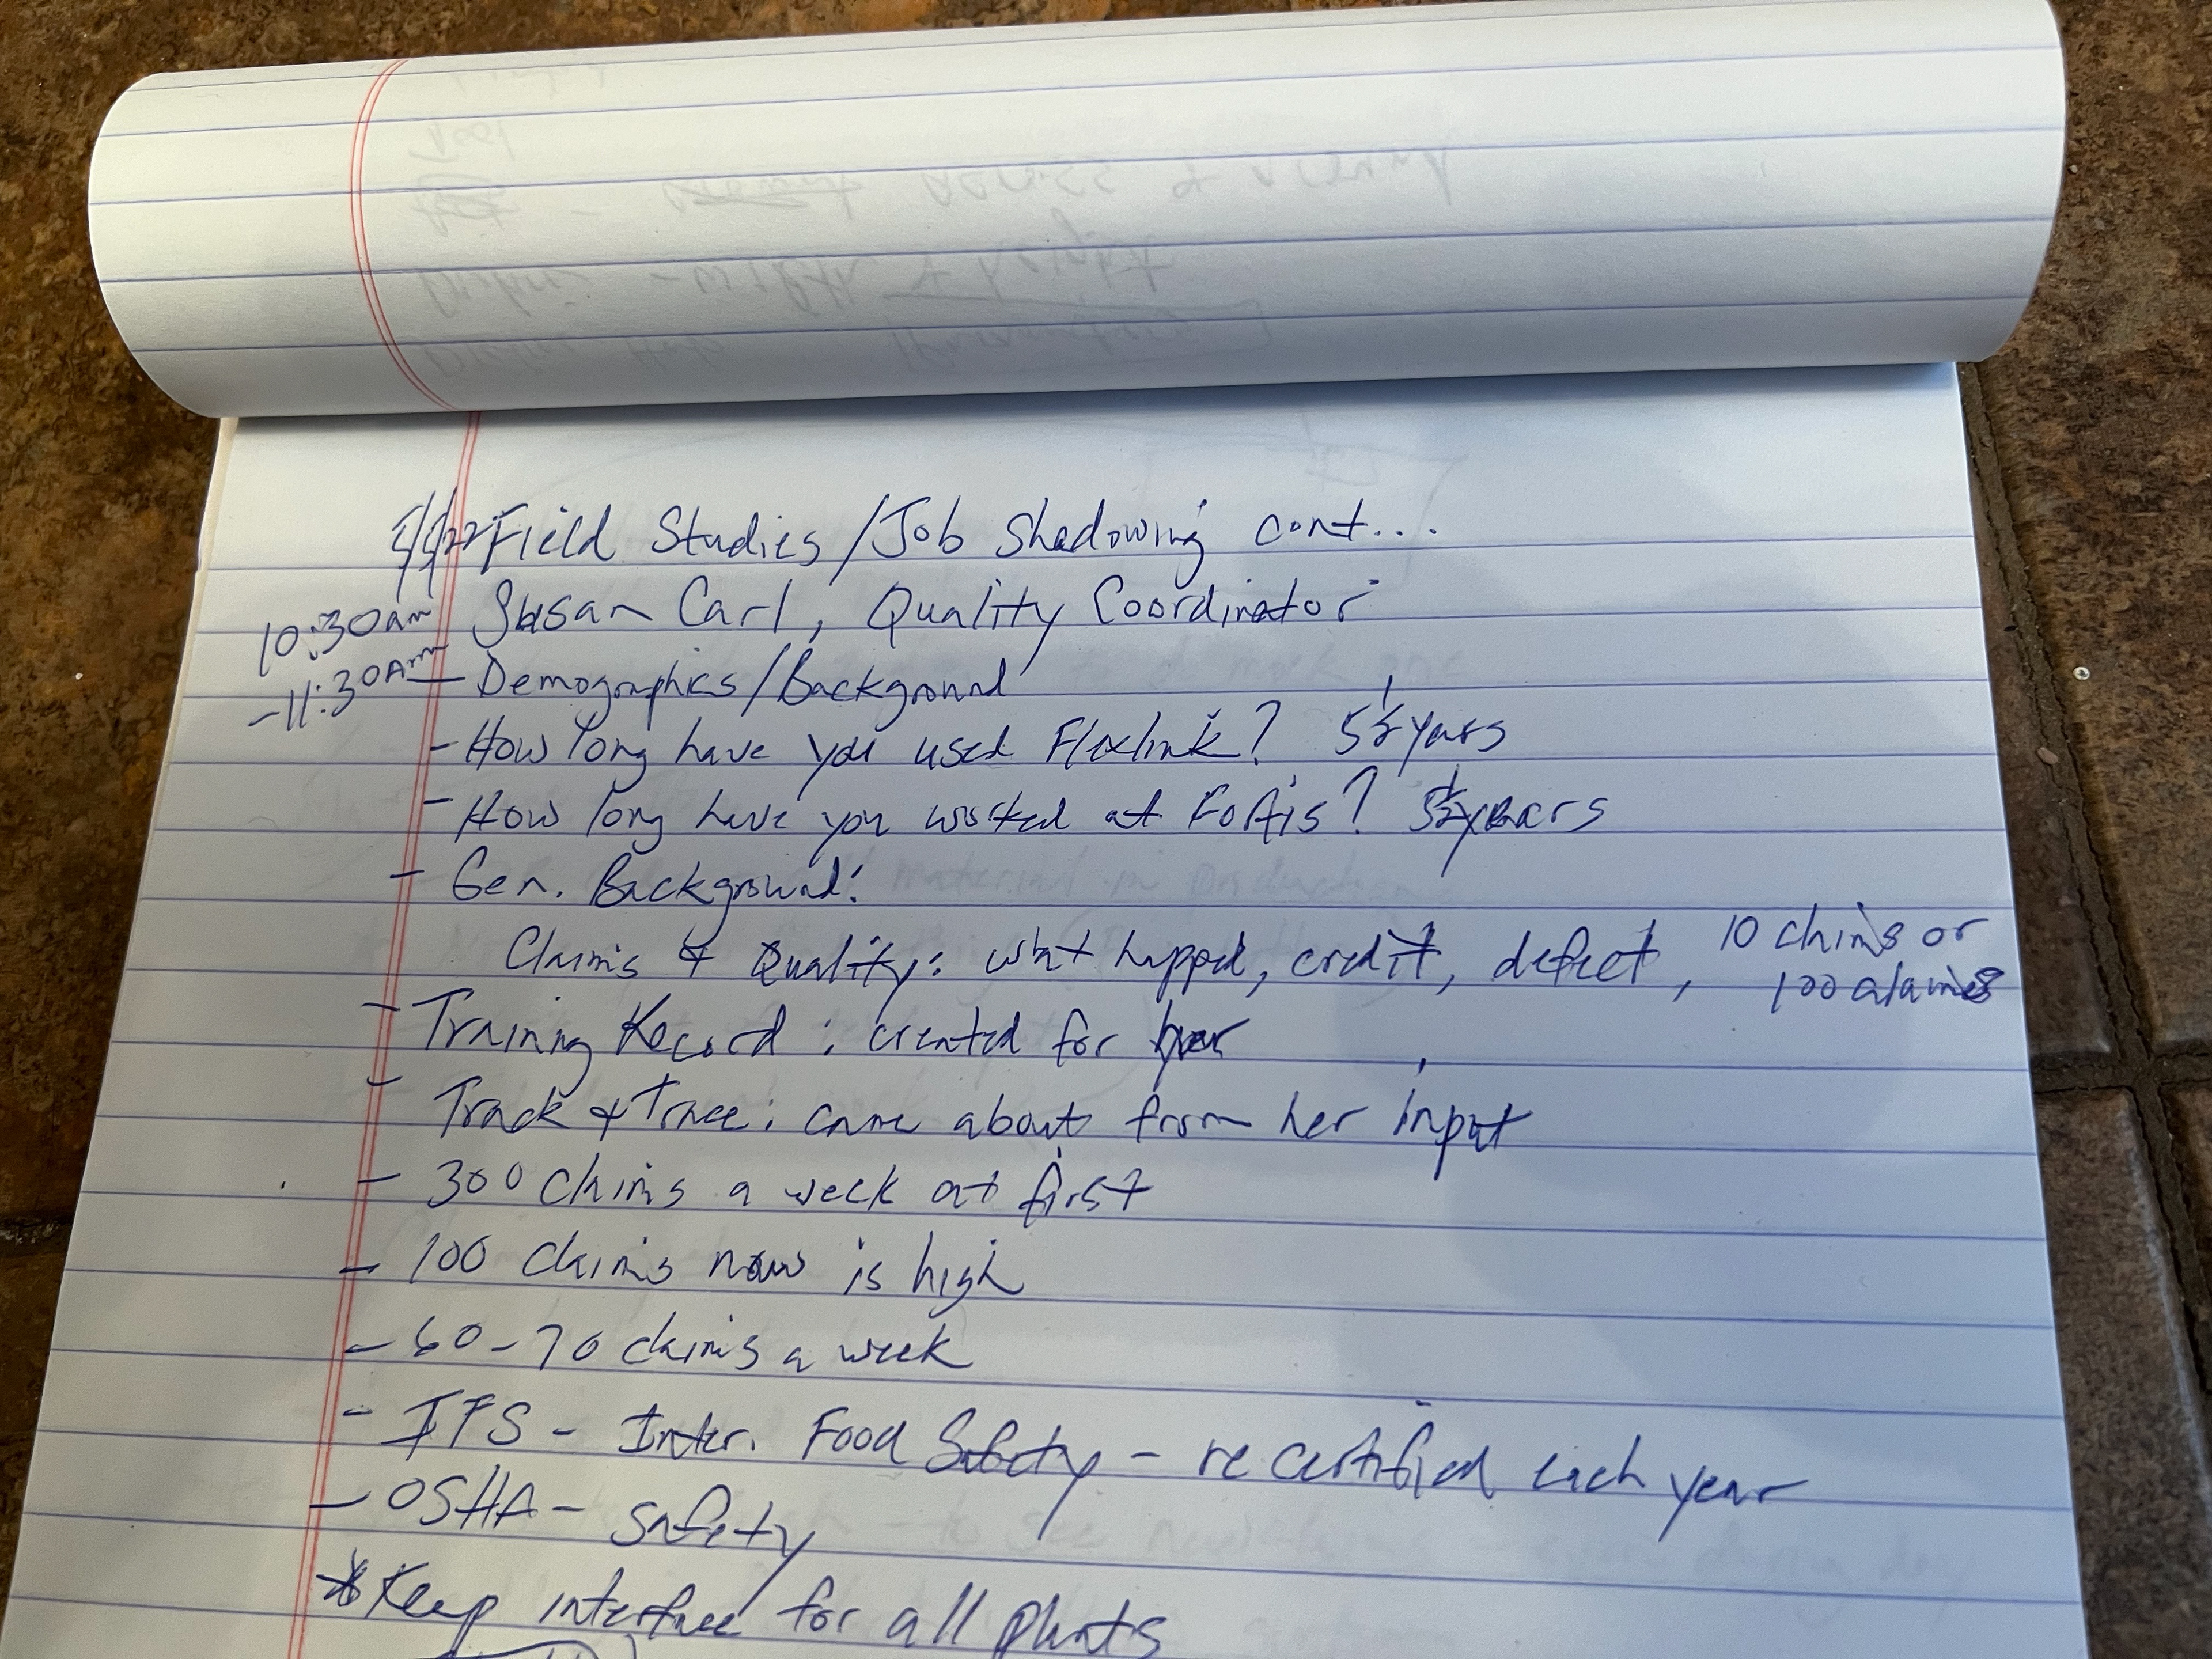
Fig. 1B: Contextual Inquiry Notes (Detail)
User Testing
I helped prepare/conduct user testing. I either created/helped with the draft for the scripts used during our prototype testing. The scripts gathered basic background of each participant and assigned them various tasks to complete from a prototype. We tested both the flow of the navigation section and a full prototype of a part of the system using Figma. These tests were video recorded, remotely and in-person. In Fig. 2 you can see an example of the type of script we used.
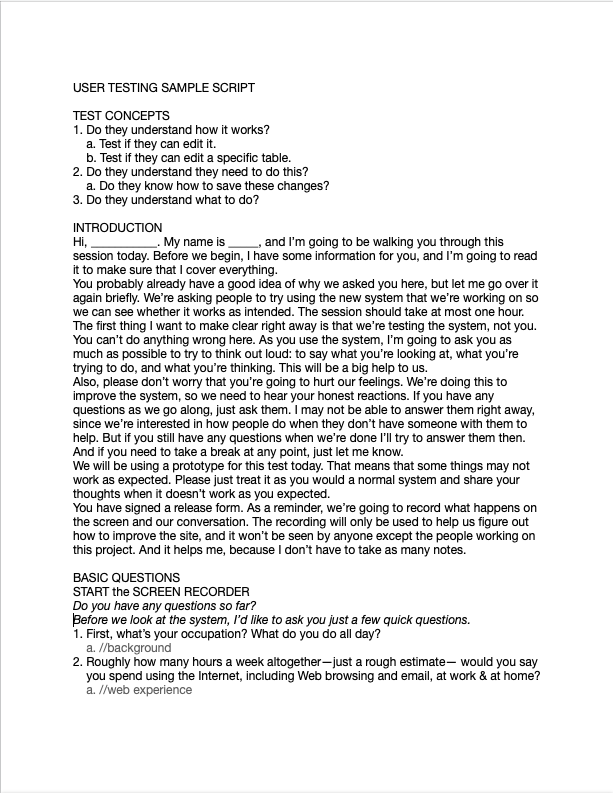
Fig. 2: Sample User Test Script
Testing Analysis
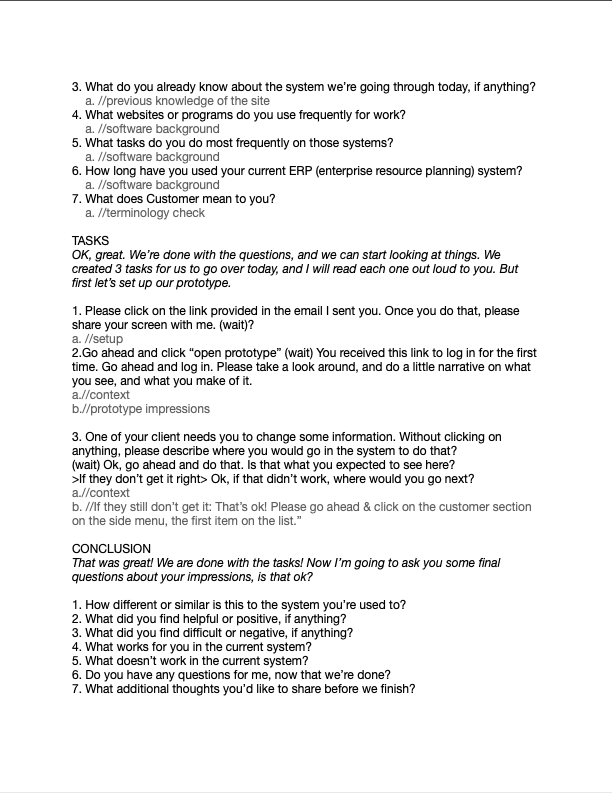
During testing a majority of our users could not complete the task which asked them to "click" an icon in the UI to enter an edit mode. After going over the results of the testing with colleagues, this problem stuck with me. No one knew why our users had trouble with this task. After doing some training/research I came across the concept of Gutenberg Diagram. It is defined as; a general pattern the eyes move through when looking at evenly distributed, homogenous information.
Source: https://vanseodesign.com/web-design/3-design-layouts/
I immediately recognized it as a possible problem for our users in the testing. In Fig. 3 on the left you can see the Gutenberg Diagram which is divided up into 4 areas; primary optical area, strong fallow area, weak fallow area and terminal area. Compared with the prototype diagram on the right you can see the icon that each participant needed to click which is located in the strong fallow area. What this meant to me was that the location of the icon was in a "blind spot" for the users in completing the task.
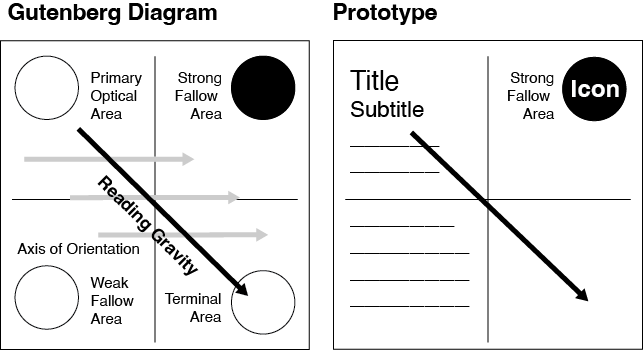
Fig. 3: Diagram comparing the Gutenberg Diagram and an abstract of our prototype.
So, after this discovery I created a presentation for other stakeholders. I presented my findings to my Supervisor, Senior Software Engineer and the Lead Designer.
Survey
I created, conducted and analyzed results for a survey of employees in the Estimating Dept. that I planned to use to create a persona. I used Microsoft Forms to create the survey and sent an email invite out to 100 participants. After about 1-2 weeks I had results from approx. 60 participants. This survey was designed to be a template to be used for several other departments. A team member and I analyzed the results in Tableau and we created an Executive Summary. At a remote meeting I presented the summary to stakeholders.
User Interviews
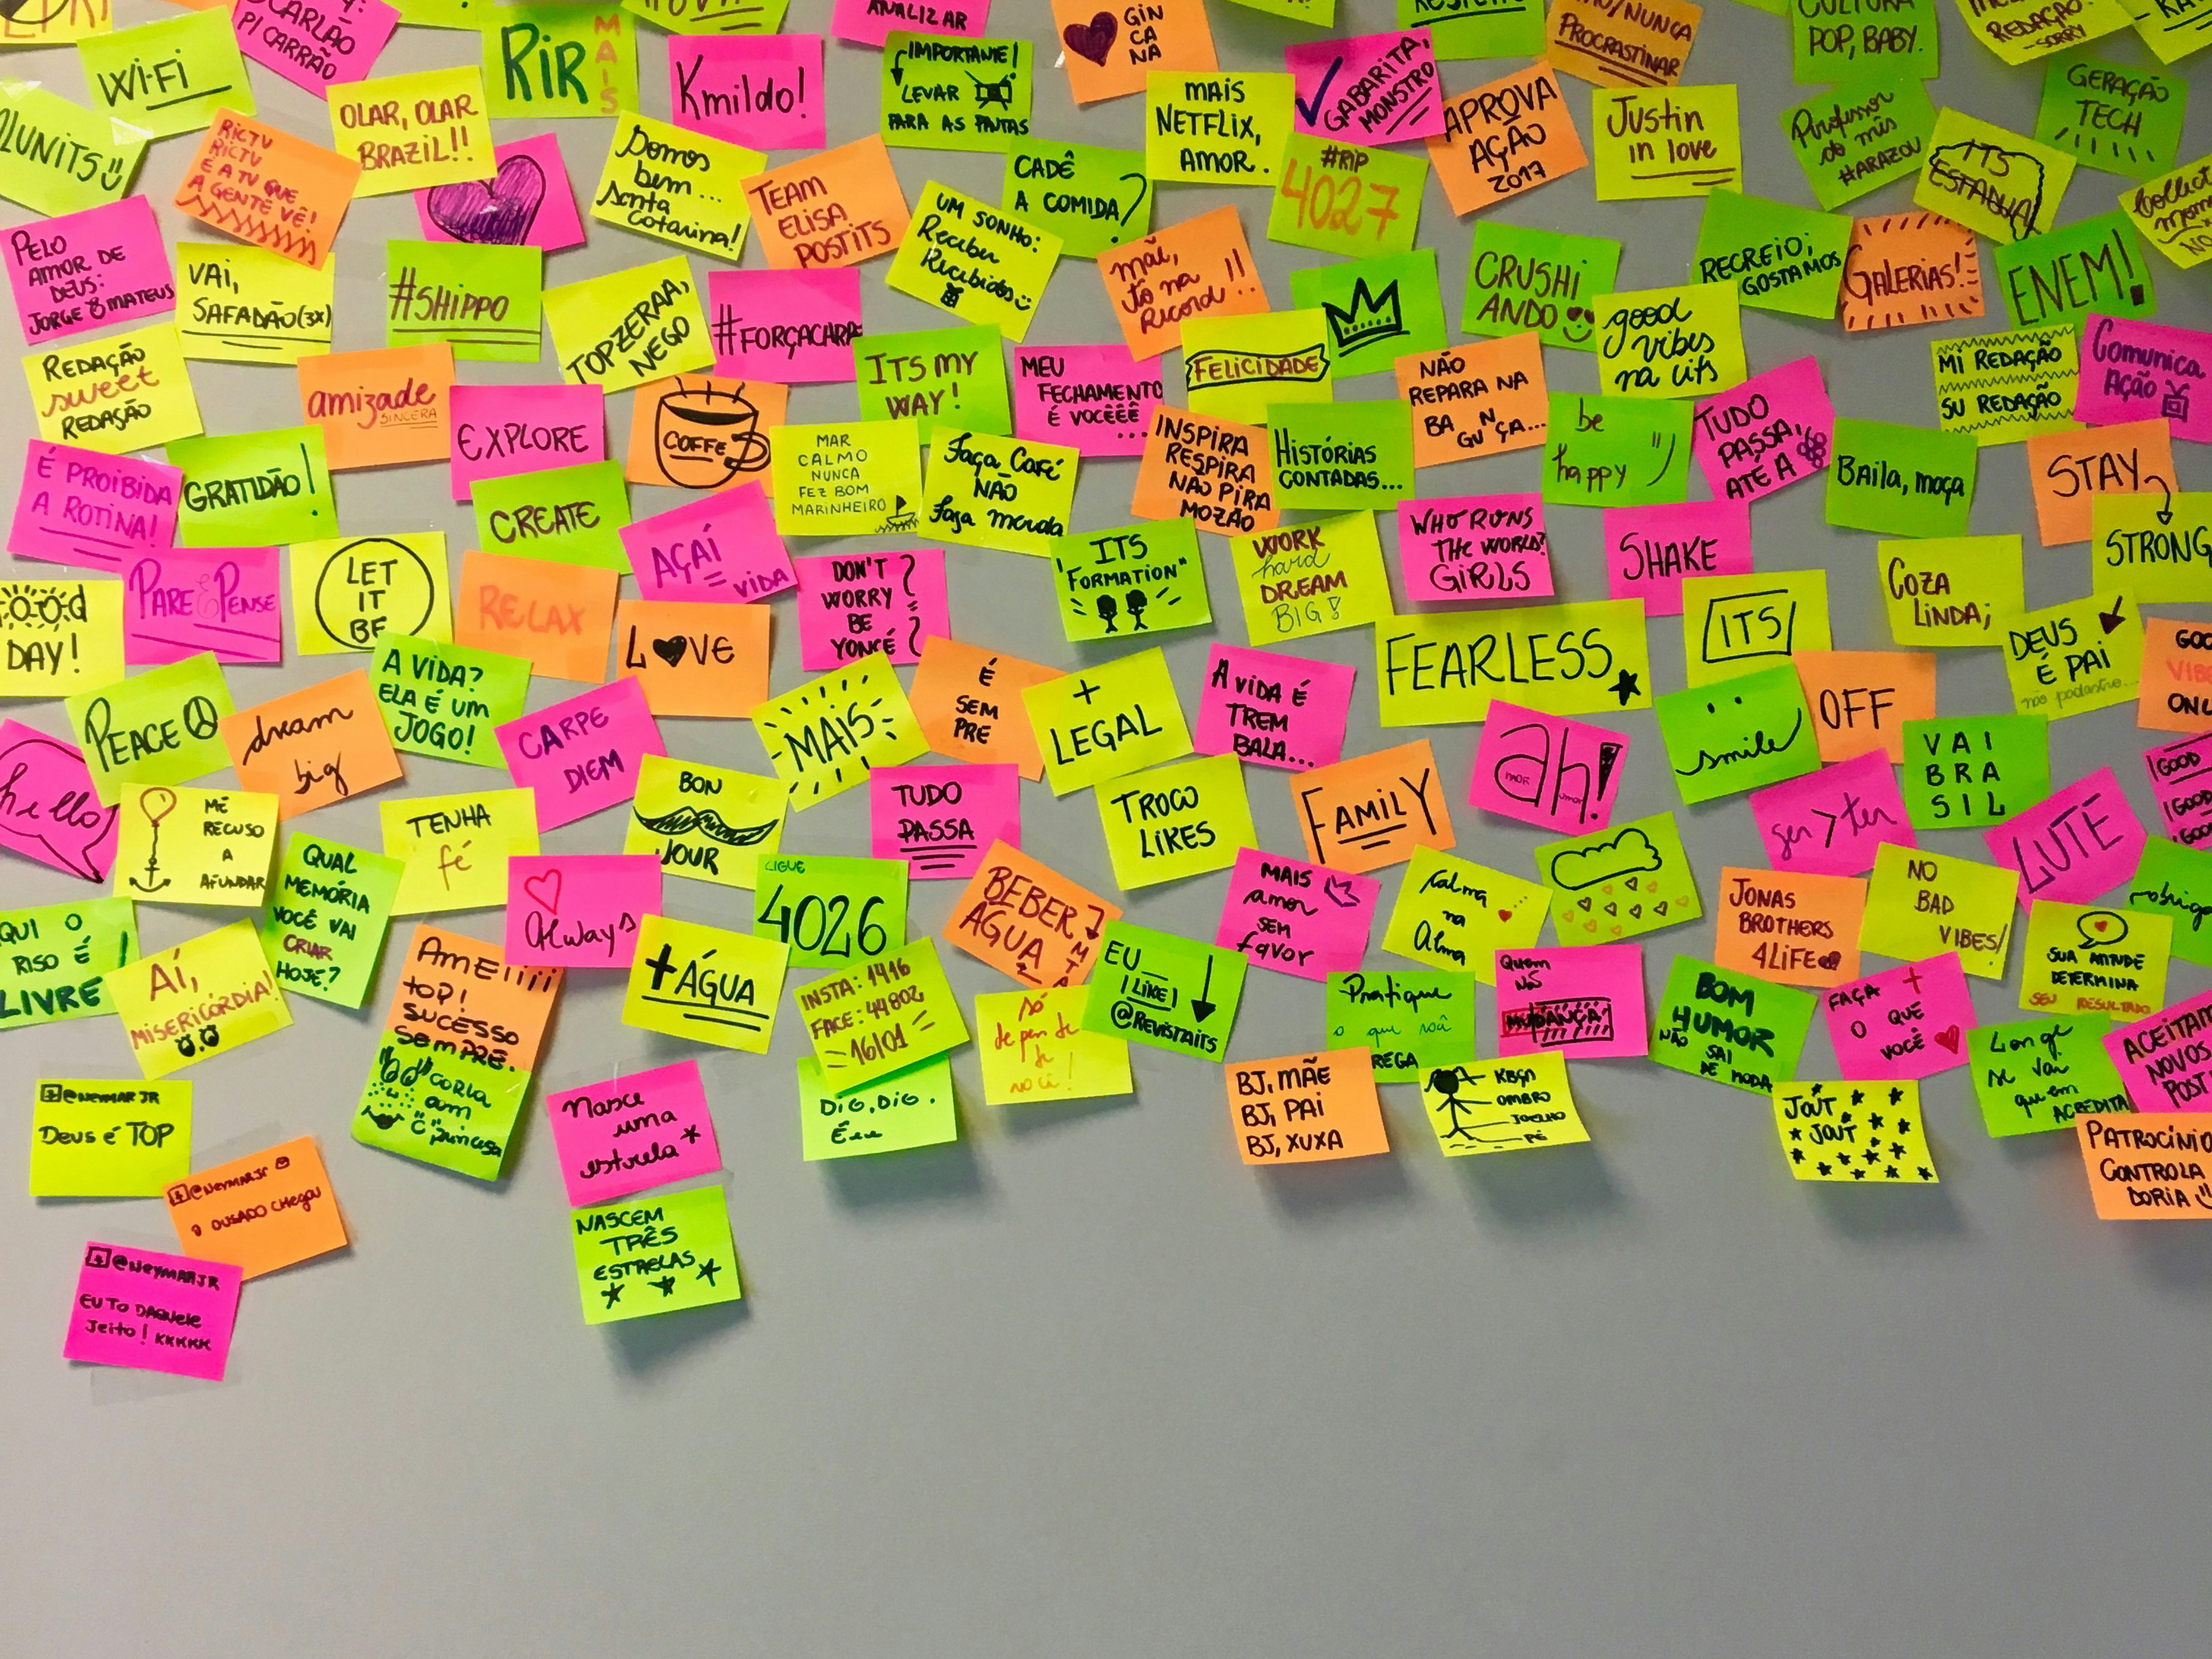
I invited and conducted 6 interviews with Customer Service users over several weeks. These were done with the purpose of creating a persona. I recorded all participants using Zoom/Teams and took notes. After the interviews were done I recorded my notes digitally and then proceeded to do thematic analysis to find commonalities in my participants responses. See Fig. 4A and 4B for an image of my sticky notes.

Fig. 4A: Board with Thematic Analysis using sticky notes

Fig. 4B: Detail of board with Thematic Analysis
Deliverables
Executive Summary
As discussed above with the help of a team member we created an executive summary to present to stakeholders. This research was based on the survey I conducted and used in a persona. We used Tableau in our data analysis and created a slide deck.
Personas
After finding common themes from my research (See Fig. 4A) I created a persona. (See Fig. 5) This persona would be a template for several departments such as; sales, prepress, estimating, etc.
During my interview I asked questions like; (Refer to Fig. 5 has annotated numbers that match questions)
1. What is your technical ratings skill? (eg., High, Medium, Low)
2. What value/skills do you bring to your job?
3. What challenges do you see in moving to a new ERP system?
4. What goals does your company have for you?
5. What features would you like to see in a new ERP?
So I used my questions from the interviews as topics, common themes as the content and added fictitious
bio info. to complete the persona.
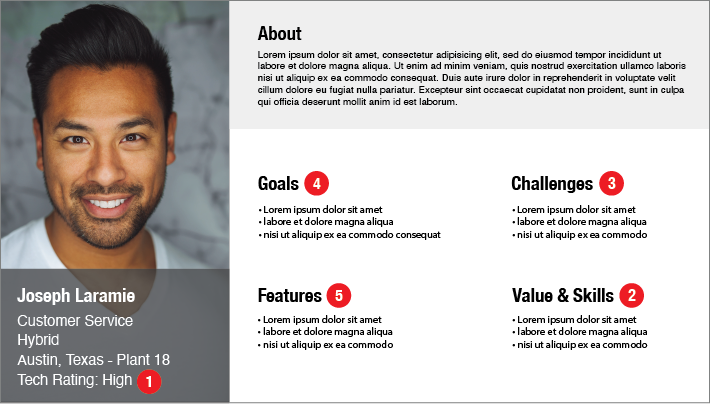
Fig. 5: Persona Template
User Interface (UI)
• Used and added to the design system while maintaining consistency
• UI designs based on Google Material design standards
• Created user flows to understand complex workflows for sales, estimating, prepress, etc. before doing designs
• Created wireframes, high-fidelity comps. in Figma that were used to handoff to developers.